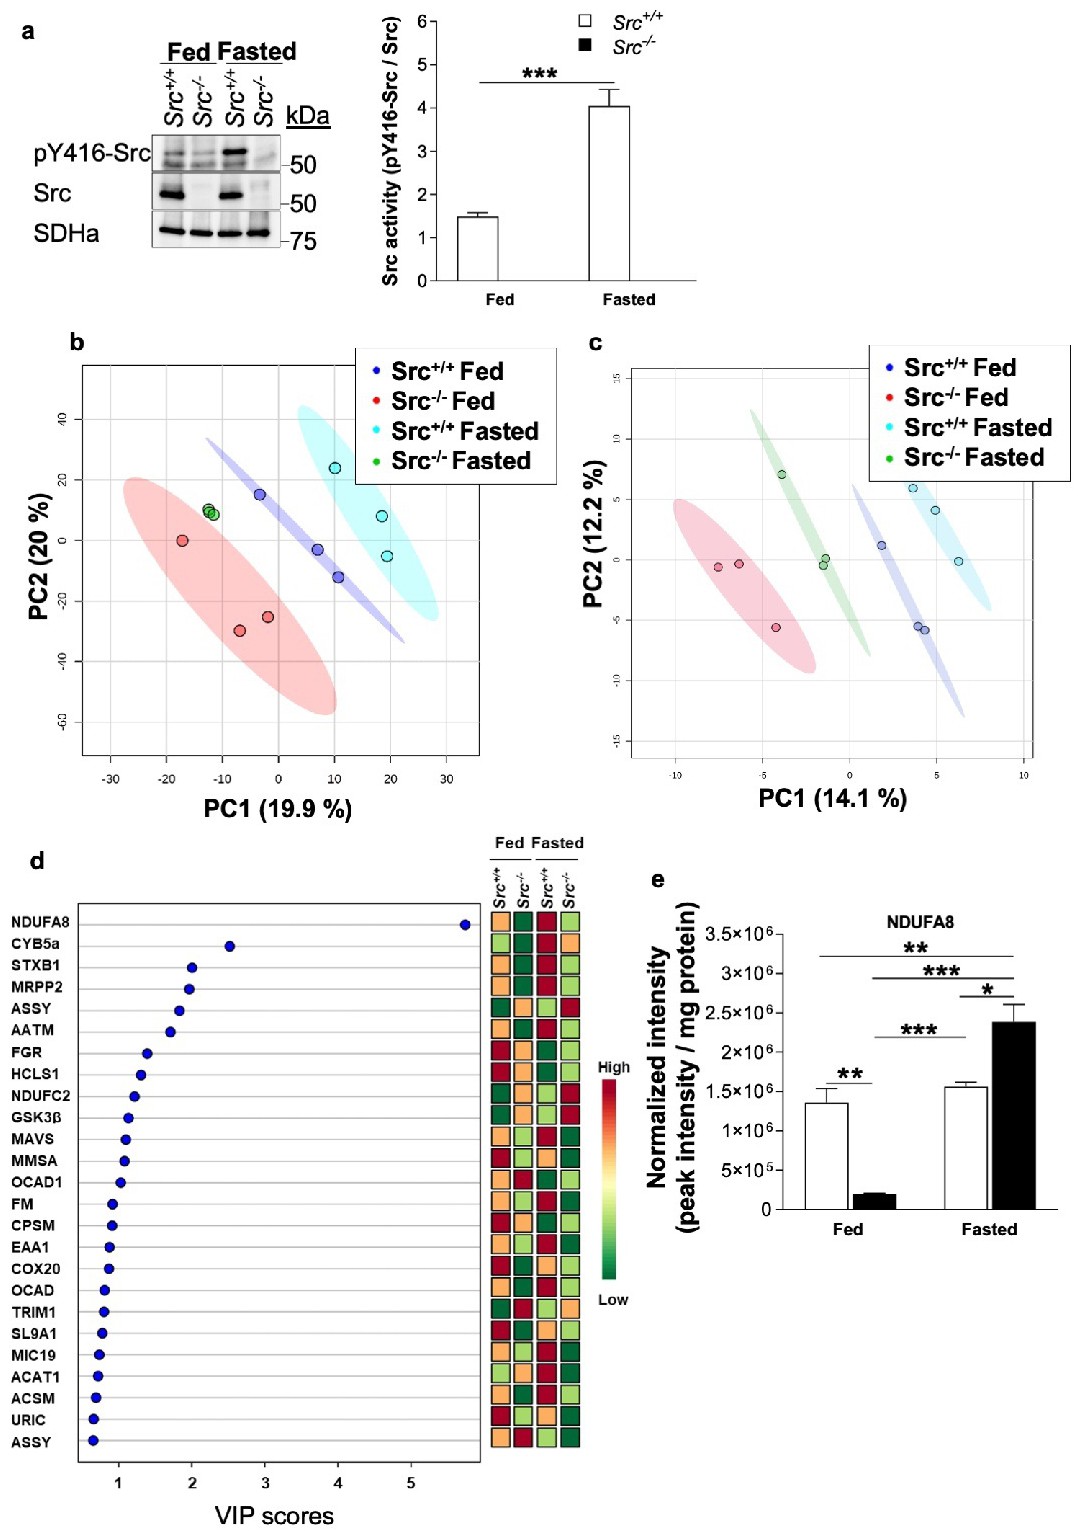
Fig. 5. The impact of Src on mitochondrial phosphotyrosine proteomics according to nutrient availability. (a) Top. Representative immunoblots (n=4) of pY416-Src, total Src and SDHa in liver mitochondria isolated from Src+/+ and Src-/- mice fed ad libitum or fasted during 24h. Note that the faint pY416-Src signal in Src-/- mice is likely due to other Src kinases present in liver mitochondria. Bottom. Quantification of Src activity (labeling of pY416-Src normalized to Src labeling), indicating that Src activity is higher upon fasting. (b, c) PLS-DA plots showing phosphotyrosine proteomic signatures of Src+/+ and Src-/- mice fed ad libitum or fasted when all phosphotyrosine peptides (b) or only mitochondrial phosphotyrosine peptides (c) detected by nanoLC-MS/MS were considered. (d) Variable importance of projection (VIP) scores of PLS-DA which identify the key proteins driving the phosphotyrosine proteomic signatures of fed and fasted Src+/+ and Src-/- mice. (e) Quantitative analysis of phosphopeptides driving the phosphotyrosine proteomic signature of Src+/+ and Src-/- mice fed ad libitum or fasted. See also Fig. S5 for key phosphotyrosine proteins not significantly different among experimental groups. Data are mean ± s.e.m. (n = 3). *p<0.05, ** p<0.01, ***p<0.001 determined by a two-way ANOVA followed by post-hoc Tukey's test.